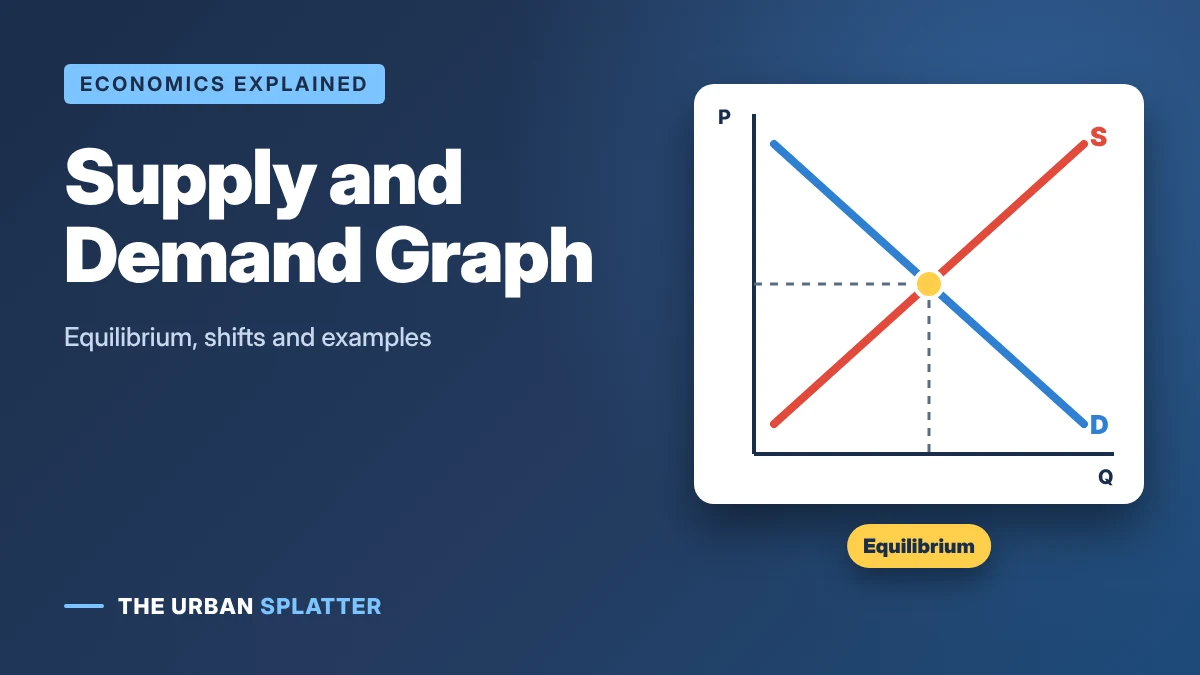
A supply and demand graph shows how the price of something and the quantity people buy and sell are linked. The downward-sloping demand curve shows what buyers will purchase at each price, the upward-sloping supply curve shows what sellers will offer, and where they cross is the equilibrium price. This guide explains how to read a supply and demand graph step by step, what happens when the curves shift, what surpluses and shortages look like and how to draw one yourself.
In this article
- The Law of Supply and Demand
- How to Read a Supply and Demand Graph
- Supply and Demand Chart (Schedule) Example
- Equilibrium, Surplus and Shortage
- Movement Along a Curve vs a Shift of the Curve
- Shifts in Demand
- Shifts in Supply
- Shifts in Both Curves: Quick Reference
- How to Draw a Supply and Demand Graph
- Real-World Supply and Demand Examples
- Practice Questions (With Answers)
- Frequently Asked Questions
- Key Takeaways
The Law of Supply and Demand
Two simple rules sit behind every supply and demand curve. According to OpenStax Principles of Economics:
- Law of demand: a higher price typically leads to a lower quantity demanded. When coffee gets more expensive, people buy less of it.
- Law of supply: a higher price typically leads to a higher quantity supplied. When coffee sells for more, cafés are willing to make and sell more.
Both rules assume ceteris paribus, Latin for “other things being equal.” In other words, only the price changes while everything else, such as incomes and costs, stays the same. The supply and demand diagram was popularized by the British economist Alfred Marshall in his 1890 book Principles of Economics, which is why it is sometimes called the Marshallian cross.
How to Read a Supply and Demand Graph
Take a simple example: the market for coffee in a small town. This table shows how many cups buyers want (quantity demanded) and how many cups cafés will sell (quantity supplied) at each price.
| Price per cup | Quantity demanded | Quantity supplied | Result |
|---|---|---|---|
| $1 | 80 | 0 | Shortage of 80 |
| $2 | 60 | 20 | Shortage of 40 |
| $3 | 40 | 40 | Equilibrium |
| $4 | 20 | 60 | Surplus of 40 |
| $5 | 0 | 80 | Surplus of 80 |
Plot these numbers with price on the vertical (y) axis and quantity on the horizontal (x) axis, and you get the graph below:
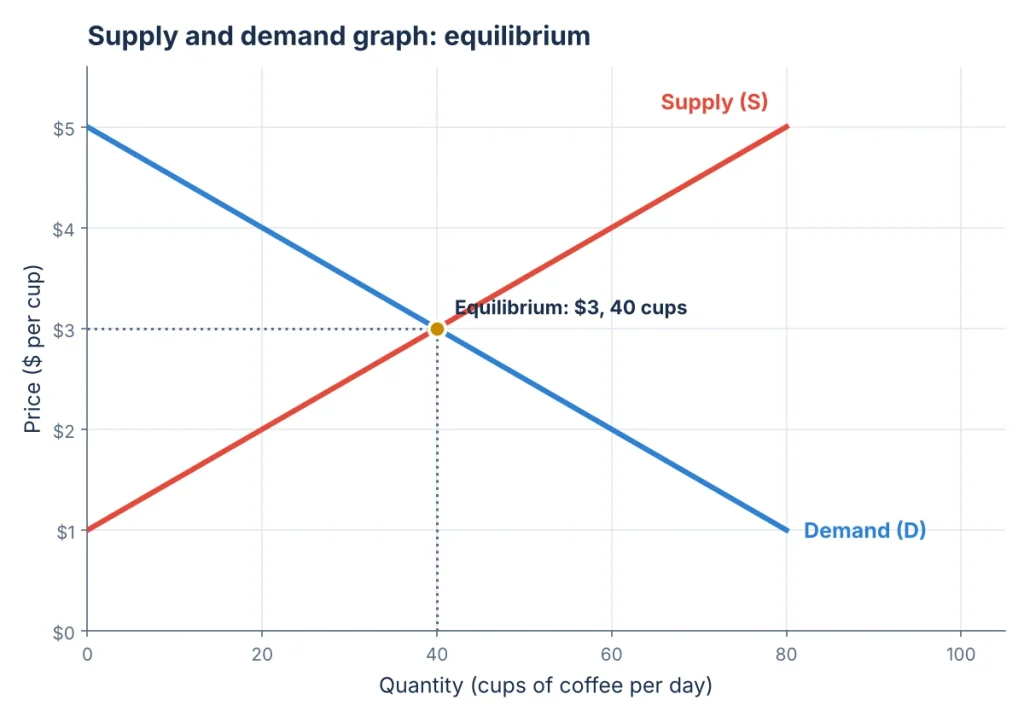
- The demand curve (D) slopes down: as the price falls, buyers want more.
- The supply curve (S) slopes up: as the price rises, sellers offer more.
- The equilibrium point is where they cross: here, $3 per cup and 40 cups a day. At this price, every cup made is a cup someone wants to buy.
Supply and Demand Chart (Schedule) Example
A supply and demand chart, also called a schedule, is a table that lists how much buyers want and sellers offer at each price. Plotting these points gives you the two curves. Here is a simple example for coffee at a local café each day:
| Price per cup | Quantity demanded | Quantity supplied | Result |
|---|---|---|---|
| $1 | 500 | 100 | Shortage of 400 |
| $2 | 400 | 200 | Shortage of 200 |
| $3 | 300 | 300 | Equilibrium |
| $4 | 200 | 400 | Surplus of 200 |
| $5 | 100 | 500 | Surplus of 400 |
Where the two quantities match ($3 and 300 cups), the curves cross. That point is the equilibrium price and quantity.
Equilibrium, Surplus and Shortage
The equilibrium price is the price at which quantity demanded equals quantity supplied. If the price is anywhere else, the market is out of balance:
- Surplus (excess supply): at $4, cafés want to sell 60 cups but buyers want only 20, leaving 40 unsold. Sellers cut prices to clear the extra stock, pushing the price back down toward $3.
- Shortage (excess demand): at $2, buyers want 60 cups but cafés offer only 20, leaving 40 people without coffee. Sellers can raise prices, pushing the price back up toward $3.
This is why markets tend to move toward equilibrium on their own: surpluses push prices down and shortages push prices up. This is the core idea behind the free enterprise system.
How to show a shortage or surplus on the graph
- Draw a horizontal line at the price you want to test.
- Mark where it meets the demand curve (quantity demanded) and the supply curve (quantity supplied).
- If the price is below equilibrium, demand is further right: the gap between the two points is the shortage.
- If the price is above equilibrium, supply is further right: the gap is the surplus.
- Label the gap with a bracket and the word “shortage” or “surplus”.
To show equilibrium, a graph must include both a downward-sloping demand curve and an upward-sloping supply curve, with labeled axes (price on the vertical axis, quantity on the horizontal axis) and the point where they cross.
Movement Along a Curve vs a Shift of the Curve
| Change | What happens on the graph |
|---|---|
| The good’s own price changes | A movement along the curve: quantity demanded or supplied changes, but the curve stays put. |
| Something else changes (income, tastes, costs, technology) | A shift of the whole curve to the left or right. |
This difference matters. “Demand rose” means the whole demand curve shifted right. “Quantity demanded rose” just means buyers moved along the same curve because the price fell.
Shifts in Demand
The demand curve shifts when something other than price changes how much people want to buy. OpenStax lists changes in tastes, population, income, the prices of substitutes and complements, and expectations about the future.
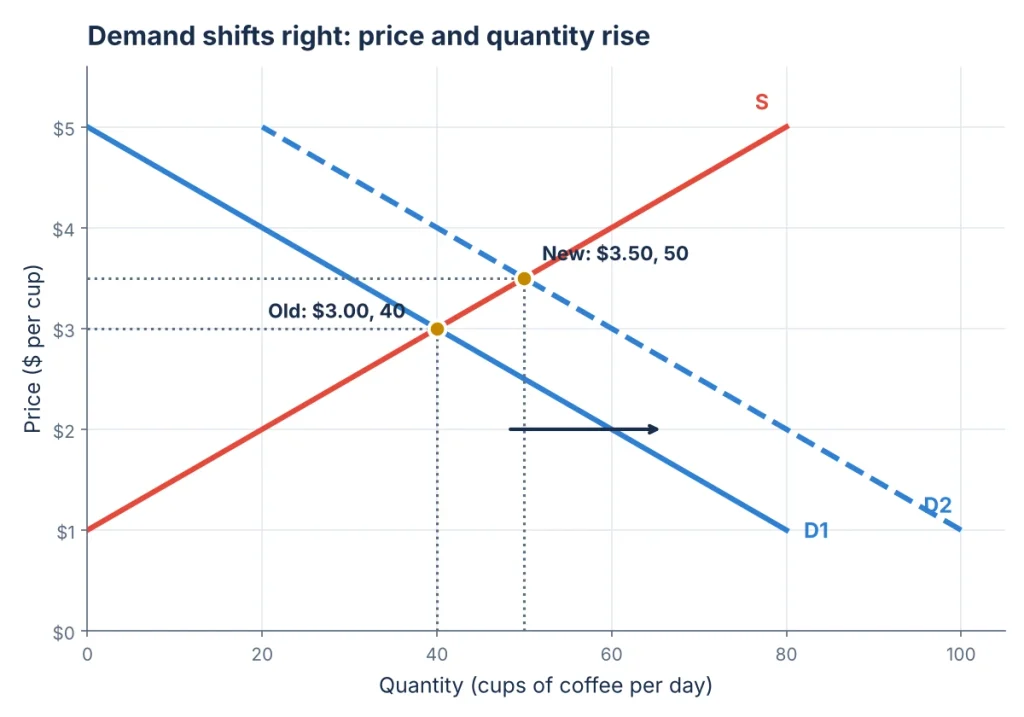
In this example, a new office opens nearby and more people want coffee at every price. Demand shifts right from D1 to D2. The new equilibrium is higher on both measures: $3.50 per cup and 50 cups a day. A fall in demand, such as that office closing, shifts the curve left and lowers both price and quantity.
| Demand shifter | Shifts demand right (increase) | Shifts demand left (decrease) |
|---|---|---|
| Income (for normal goods) | Incomes rise | Incomes fall |
| Tastes | A product becomes popular | A product goes out of fashion |
| Price of a substitute (tea) | Tea gets more expensive | Tea gets cheaper |
| Price of a complement (pastries) | Pastries get cheaper | Pastries get more expensive |
| Population | More buyers in the market | Fewer buyers |
| Expectations | People expect prices to rise soon | People expect prices to fall soon |
Shifts in Supply
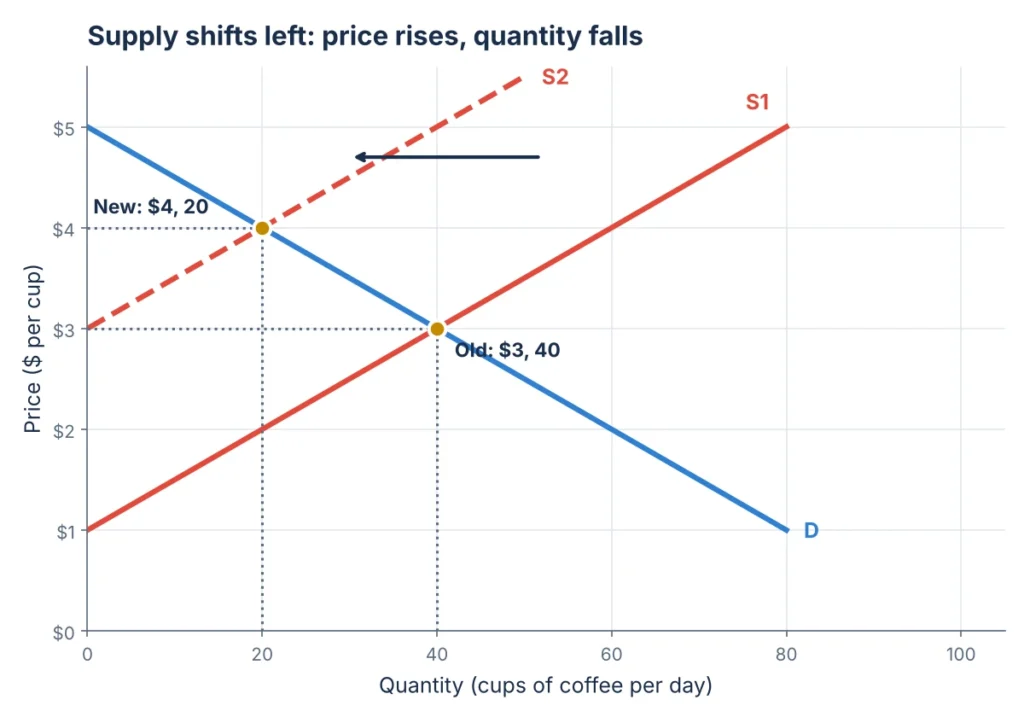
The supply curve shifts when something changes the cost or ability to produce. According to OpenStax, the main supply shifters are input prices, natural conditions, technology, and government taxes, regulations and subsidies.
Here, a poor coffee harvest raises the price of beans, so cafés supply less at every price. Supply shifts left from S1 to S2. The new equilibrium is a higher price, $4 per cup, but a lower quantity, 20 cups a day. A new, faster espresso machine would do the opposite: shift supply right, lower the price and raise the quantity.
Shifts in Both Curves: Quick Reference
| Change | Equilibrium price | Equilibrium quantity |
|---|---|---|
| Demand increases | Rises | Rises |
| Demand decreases | Falls | Falls |
| Supply increases | Falls | Rises |
| Supply decreases | Rises | Falls |
| Demand and supply both increase | Depends on which shifts more | Rises |
| Demand rises, supply falls | Rises | Depends on which shifts more |
How to Draw a Supply and Demand Graph
- Draw two axes: price on the vertical axis and quantity on the horizontal axis. Label both.
- Draw a downward-sloping line from the top left and label it D (demand).
- Draw an upward-sloping line from the bottom left and label it S (supply).
- Mark the point where they cross as the equilibrium. Draw dotted lines to each axis and label the equilibrium price (P*) and quantity (Q*).
- To show a change, draw the new curve (D2 or S2), mark the new equilibrium and add an arrow showing the direction of the shift.
You can draw one by hand, or in Excel or Google Sheets using a scatter chart with straight lines from a price and quantity table like the one above.
Real-World Supply and Demand Examples
- Concert tickets: a sold-out show with long queues is a shortage at the ticket price, which is why resale prices climb.
- Gas prices: when oil supply is cut, the supply curve for gasoline shifts left and pump prices rise.
- Holiday flights: demand rises sharply around holidays, so fares go up.
- Summer fruit: a large harvest shifts supply right, so strawberries are cheaper in peak season.
- New technology: as production of TVs and phones gets cheaper, supply shifts right and prices fall over time.
Practice Questions (With Answers)
A frost destroys much of the orange crop. What happens to the supply curve, price and quantity?
Supply shifts left; price rises; quantity falls.
A new study says coffee is healthy. What happens to demand for coffee?
Demand shifts right; price and quantity both rise.
The price of a product is set above equilibrium. Is there a shortage or a surplus?
A Surplus.
Incomes rise and a cheaper production method is invented at the same time. What happens to quantity?
Quantity rises; the price change depends on which shift is bigger.
The price of tea (a substitute) falls. What happens to demand for coffee?
Demand for coffee shifts left.
Frequently Asked Questions
What does a supply and demand graph show?
It shows how much buyers want and how much sellers offer at different prices, and the equilibrium price where the two are equal.
Why does the demand curve slope downward?
Because people buy more of most goods when they are cheaper, and less when they are more expensive.
What is the difference between a change in demand and a change in quantity demanded?
A change in quantity demanded is a movement along the curve caused by a price change. A change in demand is a shift of the whole curve caused by something else, such as income or tastes.
What is the equilibrium price?
It is the price at which the quantity buyers want equals the quantity sellers offer, where the supply and demand curves cross.
What is the difference between a supply and demand graph and chart?
A chart (or schedule) is a table of prices and quantities. A graph plots that table as two curves so you can see equilibrium, shortages and surpluses at a glance.
What must be included on a graph to show equilibrium?
Both a demand curve and a supply curve, labeled axes for price and quantity, and the point where the two curves meet, marked with the equilibrium price (P) and quantity (Q).
Key Takeaways
Read the graph by finding where supply and demand cross, then ask whether a change moves along a curve or shifts it. For more plain-English guides to economics and money, explore the latest articles on The Urban Splatter.